We recently published a TechBrief “What is MTF?” to our Knowledge Base. It provides an overview of the Modulation Transfer Function, also called the Optical Transfer Function, and why MTF provides an important measure of lens performance. That’s particularly useful when comparing lenses from different manufacturers – or even lenses from different product families by the same manufacturer. With that TechBrief as the appetizer course, let’s dig in a little deeper and look at how to read an MTF lens curve. They can look a little intimidating at first glance, but we’ll walk you through it and take the mystery out of it.
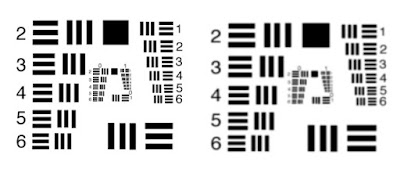
Test charts cluster alternating black and white strips, or “line pairs”, from coarse to fine gradations, varying “spatial frequency”, measured in lines / mm, in object space. The lens, besides mapping object space onto the much smaller sensor space, must get the geometry right in terms of correlating each x,y point to the corresponding position on the sensor, to the best of the lens’ resolving capacity. Furthermore, one wants at least two pixels, preferably 3 or more, to span any “contrast edge” of a feature that must be identified.
So one has to know the field of view (FOV), the sensor size, the pixel pitch, the feature characteristics, and the imaging goals, to determine optical requirements. For a comprehensive example please see our article “Imaging Basics: How to Calculate Resolution for Machine Vision“.
Unpacking Modulation Transfer Function, let’s recall that “transfer” is about getting photons presented at the front of the lens, coming from some real world object, through glass lens elements and focused onto a sensor consisting of a pixel array inside a camera. In addition to that nifty optical wizardry, we often ask lens designers and manufacturers to provide lens adjustments for aperture and variable distance focus, and to make the product light weight and affordable while keeping performance high. “Any other wishes?” one can practically hear the lens designer asking sarcastically before embarking on product design.
So as with any complex system, when transferring from one medium to another, there’s going to be some inherent lossiness. The lens designer’s goal, while working within the constraints and goals mentioned above, is to achieve the best possible performance across the range of optical and mechanical parameters the user may ask of the lens in the field.
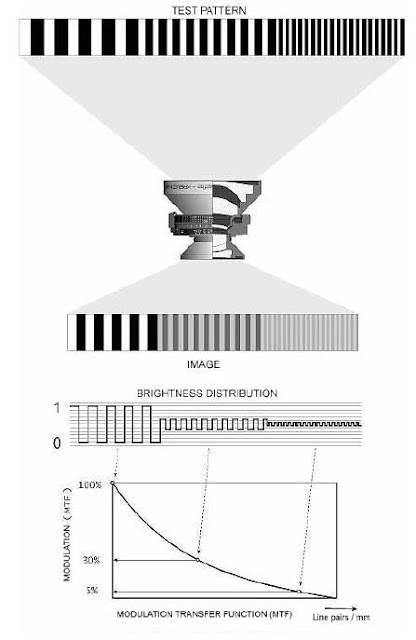
Consider Figure B1 below, taken from comprehensive Figure B. This shows the image generated from the camera sensor, in effect the optical transfer of the real world scene through the lens and projected onto the pixel array of the sensor. The widely-spaced black stripes – and the equally-spaced white gaps – look really crisp with seeming perfect contrast, as desired.
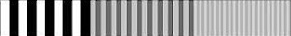
But for the more narrowly-spaced patterns, light from the white zones bleeds into the black zones and substantially lowers the image contrast. Most real world objects, if imaged in black and white, would have shades of gray. But a test chart, at any point position, is either fully black or fully white. So any pixel value recorded that isn’t full black or full white represents some degradation in contrast introduced by the lens.
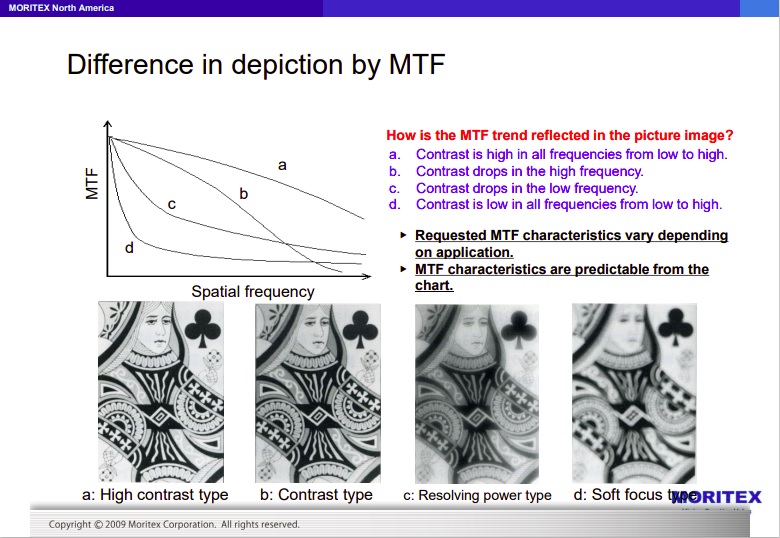
The MTF graph is a visual representation of the lens’ ability to maintain contrast across a large collection of sampled line pairs of varying widths.
Let’s look at Figure B2, an example MTF curve:
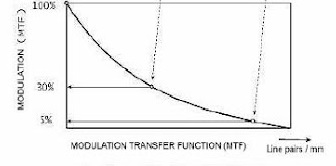
- the horizontal axis denotes spatial frequency in line pairs per millimeter; so near the origin on the left, the line pairs are widely spaced, and progressively become more narrowly spaced to the right
- the vertical axis denotes the modulation transfer function (MTF), with high values correlating to high contrast (full black or full white at any point), and low values representing undesirable gray values that deviate from full black or full white
The graph in Figure B2 only shows lens-center MTF, for basic discussions, and does not show performance on edges, nor take in account f# and distance. MTF, and optics more generally, are among the more challenging aspects of machine vision, and this blog is just a primer on the topic.

we will contact you to assist
In very general terms, we’d like a lens’ MTF plot to be fairly close to the Diffraction Limit – the theoretical best-case achievable in terms of the physics of diffraction. But lens design being the multivariate optimization challenge that it is, achieving near perfection in performance may mean lots of glass elements, taking up space, adding weight, cost, and engineering complexity. So a real-world lens is typically a compromise on one or more variables, while still aiming to achieve performance that delivers good results.
How good is good enough? When comparing two lenses, likely in different price tiers that reflect the engineering and manufacturing complexity in the respective products, should one necessarily choose the higher performing lens? Often, yes, if the application is challenging and one needs the best possible sensor, lighting and lensing to achieve success.
But sometimes good enough is good enough. It depends. For example, do you “just” need to detect the presence of a hole, or do you need to accurately measure the size of the hole? The system requirements for the two options are very different, and may impact choice of sensor, camera, lens, lighting, and software – but almost certainly sensor and lensing. Any lens can find the hole, but a lens capable of high contrast is needed for accurate measurement.
Here’s one general rule of thumb: the smaller the pixel size, the better the optics need to be to obtain equivalent resolution. As sensor technology evolves, manufacturers are able to achieve higher pixel density in the same area. Just a few years ago the leap from a VGA sensor to 1 or 5 MegaPixels (MP) was considered remarkable. Now we have 20 and 50 MP sensors. That provides fantastic options to systems-builders, creating single-camera solutions where multiple cameras might have been needed previously. But it means one can’t be careless with the optical planning – in order to achieve optimal outcomes.
Not all lens manufacturers express their MTF charts identically, and testing methods vary somewhat. Also, note that many provide two or even three lens families for each category of lenses, in order to provide customers with performance and pricing tiers that scale to different solutions requirements. To see an MTF chart for a specific lens, click first on a lens manufacturer pages such as Moritex, then on a lens family page, then on a specific lens. Then find the datasheet link, and scroll within the datasheet PDF to find the MTF curves and other performance details.

Besides the theoretical approach to reading specifications prior to ordering a lens, sometimes it can be arranged to send samples to our lab for us to take sample images for you. Or it may be possible to test-drive a demo lens at your facility under your conditions. In any case, let us help you with your component selection – it’s what we do.
Finally, remember that some universities offer entire degree programs or specializations in optics, and that an advanced treatment of MTF graph interpretation could easily fill a day-long workshop or more – assuming attendees met certain prerequisites. So this short blog doesn’t claim to provide the advanced course. But hopefully it boosts the reader’s confidence to look at MTF plots and usefully interpret lens performance characteristics.

1st Vision’s sales engineers have over 100 years of combined experience to assist in your camera and components selection. With a large portfolio of lenses, cables, NIC card and industrial computers, we can provide a full vision solution!
Acknowledgement / Credits: Special thanks to MORITEX North America for permission to include selected graphics in this blog. We’re proud to represent their range of lenses in our product offerings.